Gents
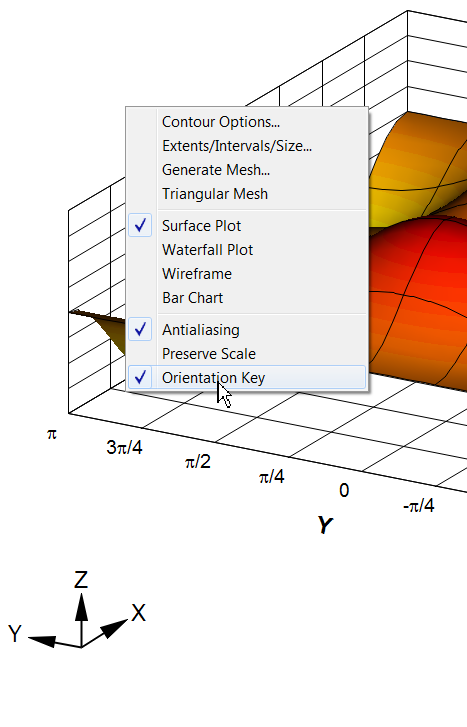
I would like suggest you add an option that allow the visualization of X, Y and Z axes directions in a 3D plot (countor option - 3D view). I mean that in the bottom left corner of the picture it appear three little axes showing the X, Y and Z directions in the main picture.
regards
L F Neumann
Adding X, Y, Z axes in 3D plot
Moderator: DPlotAdmin
-
DPlotAdmin

- Posts: 2312
- Joined: Tue Jun 24, 2003 9:34 pm
- Location: Vicksburg, Mississippi
- Contact:
-
DPlotAdmin
- Posts: 2312
- Joined: Tue Jun 24, 2003 9:34 pm
- Location: Vicksburg, Mississippi
- Contact:
This will be available in the next release:
... with a couple of caveats:
... with a couple of caveats:
- No effort is made to include this graphic in the clipping region for saved bitmaps or copied bitmaps/metafiles. On the other hand the graphic will be drawn, but it may be clipped. This will likely be improved in a future release. The problems are:
- including it may increase the dimensions of the bitmap/metafile to silly extents with a lot of white space, much larger than the picture would be w/o that graphic, and
- the obvious solution: moving the graphic to the lower-left corner of the image that is saved/copied, might lead to the graphic overlapping other plot attributes (particularly true with next version's ability to draw the legend on the left or bottom). It is possible that both problems might be overcome by making an intelligent decision about where to draw it: if the legend is on the right, draw it in the lower-left; if the legend is on the left, draw it in the lower-right; if the legend is at the bottom, draw it in the upper-left, etc.
- The option (like the legend placement) will most likely only be available via right-click menu. This is a kinda sorta effort to hide this from "normal" users and expose it only to the true believers, in hopes the more understanding true believers will offer suggestions and point out problems with, for example, overlapping stuff.
Visualize Your Data
support@dplot.com
support@dplot.com