3D Parametric Equations, Cylindrical & Spherical Coordin
Posted: Fri Aug 20, 2010 10:55 pm
Do you have any plans to extend 3D capabilities to allow representing 3D parametric equations?
Also, like 2D polar coordinates, in conjunction with 3D it would be nice to be able to represent equations in cylindrical or spherical coordinates.
Check out the following website for capability I'd like to see in DPlot:
http://www.flashandmath.com/advanced/mo ... ion3d.html
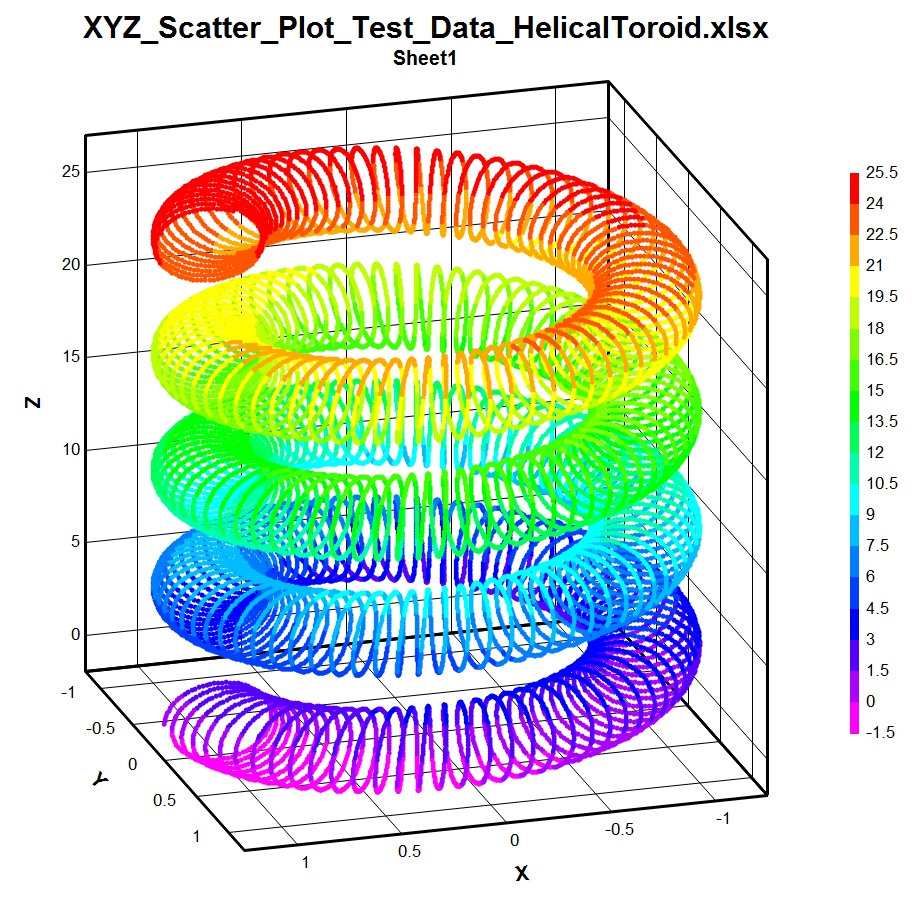
As a specific example, I wanted to find an equation for a form that I call (for lack of finding proper technical term for it) a 'helical toroid' coil winding. The following provides a decent example of what I wanted to achieve (except that the website above has limited plotting increments so it has somewhat grainy resolution):
x =(1+0.25*cos(75*t))*cos(t)
y = (1+0.25*cos(75*t))*sin(t)
z = 1+2.0*sin(75*t)
The reason I wanted such an equation was to take it to an FEA modeling program to see what kind of magnetic field such a coil would create (I still haven't got this far yet so don't ask me what the result was - If you know how to do this already please let me know!)
Ray Delaforce
Also, like 2D polar coordinates, in conjunction with 3D it would be nice to be able to represent equations in cylindrical or spherical coordinates.
Check out the following website for capability I'd like to see in DPlot:
http://www.flashandmath.com/advanced/mo ... ion3d.html
As a specific example, I wanted to find an equation for a form that I call (for lack of finding proper technical term for it) a 'helical toroid' coil winding. The following provides a decent example of what I wanted to achieve (except that the website above has limited plotting increments so it has somewhat grainy resolution):
x =(1+0.25*cos(75*t))*cos(t)
y = (1+0.25*cos(75*t))*sin(t)
z = 1+2.0*sin(75*t)
The reason I wanted such an equation was to take it to an FEA modeling program to see what kind of magnetic field such a coil would create (I still haven't got this far yet so don't ask me what the result was - If you know how to do this already please let me know!)
Ray Delaforce