Page 1 of 1
Preferred Method for Exporting DPlot charts to PowerPoint?
Posted: Thu Sep 29, 2005 11:27 am
by Schwer
I have tried several methods of importing DPlot charts to PowerPoint including clipboard and first saving as a *.png file. Everything I have tried fails to properly scale the legend portion of the image.
What am I missing or doing wrong? Thanks, --len
Posted: Thu Sep 29, 2005 1:17 pm
by DPlotAdmin
Len,
For bitmaps copied to the clipboard: Select Edit>Copy>Dimensions and set both the width and height to 0. This will result in creating a bitmap that is identical in every way to the plot you see on your display. In PowerPoint, select Edit>Paste Special and select "Device Independent Bitmap".
For bitmap images saved to disk (whether bmp, png, gif, etc), enter 0 for both the width and height when prompted for those values.
For metafiles copied to the clipboard, select Options>Extents/Tick Marks/Size and check the "Specify Size" box, then enter the desired dimensions of the picture in inches. In PowerPoint select Edit>Paste Special and select "Picture (enhanced metafile)".
If you still have trouble getting the results you expect please save your graph as a DPlot file and send it to me.
Posted: Thu Sep 29, 2005 1:52 pm
by Schwer
Thanks David!
The suggested bitmap save to clipboard & disk work fairly well, but the metafile to clipboard did not properly scale the chart's legend when pasted into Powerpoint.
Right now, saving the bitmap as a *.png file and then importing that file into PowerPoint seems to provide the best final image quality after some image scaling.
Thanks again for the help and QUICK response! --len
PS - I will email you a sample *.grf file.
Posted: Thu Sep 29, 2005 2:08 pm
by DPlotAdmin
I'll play around with your plot as soon as I get it. Just an FYI - if your final product is a PowerPoint slideshow, then a PNG file (or other bitmap format) is as good as it gets. But if you plan to print the slides then a metafile will be better, since it is (mostly) resolution-independent. With a bitmap you'll likely see some pixelation.
Posted: Thu Sep 29, 2005 2:20 pm
by DPlotAdmin
Len,
In the DPlot file you sent you are allowing DPlot to choose the plot size. In other words - under Options>Extents/Tick Marks/Size you do not have "Specify plot size" checked. If I check that option and use 7x7 inches, then here's what I see in DPlot:
and here's a screenshot of what I get in PowerPoint:
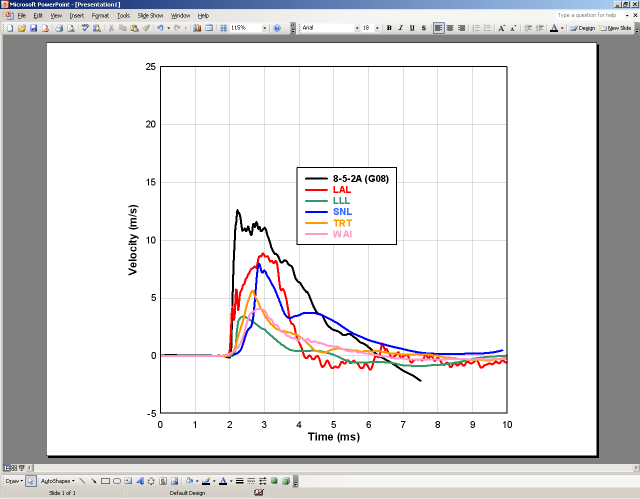
They aren't
exactly the same, but this is about as close as it will get.
Posted: Thu Sep 29, 2005 2:46 pm
by Schwer
Thanks again David. I see how specifying the plot size works for bitmaps. But with the bitmaps, you want the DPlot size to be about the same size as the final image in PowerPoint, else a lot a scaling (down sizing) ruins the image quality. But as I shrink the DPlot window size, to say 2x4, the legend remains the SAME size as in a larger plot size version, say 4x6. [If I knew how to insert images in this BB I would :(]
I think I'll stick with the *.png method as that seems most straightforward to me, although it adds an intermediate step of saving the *.png file.
Thanks again, --len
Posted: Thu Sep 29, 2005 3:01 pm
by DPlotAdmin
Not to be disagreeable, but... with bitmap images if you set the width and height to 0 (for copied images using Edit>Copy>Dimensions; for saved files answering the prompt) then the result will be, not just close, but
exactly what appears on your display, regardless of whether the document is maximized or not. This behavior (for bitmaps) is independent of whether you use "Specify plot size" or not. If that's not the behavior you're seeing then either you're using a relatively old version or I'm completely insane

Inserting images: unfortunately images cannot be stored within the forums; they must reside somewhere on the internet and are linked with img tags.
Posted: Thu Sep 29, 2005 3:14 pm
by DPlotAdmin
By the way... just to make sure we're not getting signals crossed: the captured PowerPoint screenshot is of a pasted enhanced metafile, not a bitmap.
Posted: Thu Sep 29, 2005 3:18 pm
by DPlotAdmin
Not completely insane, but I see where I was confused. For clipboard operations everything I said is correct. But when saving an image file, the legend is indeed a different size than shown on the display unless you also have "Specify plot size" checked. Off the top of my head this seems to be a bug; will look into fixing this right away.
Posted: Thu Sep 29, 2005 5:36 pm
by DPlotAdmin
Len,
Sorry for all the runaround. Select Help>Check for Updates to get the fix. If you set either the width or height to 0 then saved image files will always (always, always, I promise
) be identical to what you see on the screen. There are also a couple of other fixes related to exporting metafiles that you can read about on the
Revision History page.
Posted: Sun Oct 02, 2005 1:55 pm
by Schwer
At the risk of wearing your patience too thin, I'd like to pursue this topic a bit further.
Including bitmaps, EMF, or *.png files at full size is not the cruix of the problem. The problem is resizing the the image after it is imported to PowerPoint.
To illustrate my points, I have placed a sample DPlot file on my ftp server, along with a PowerPoint file with examples of imports from DPLot and thier 50% scaled versions.
ftp://ftp.sonic.net/pub/users/lschwer/9 ... loglog.grf
ftp://ftp.sonic.net/pub/users/lschwer/Test-DPlot.ppt
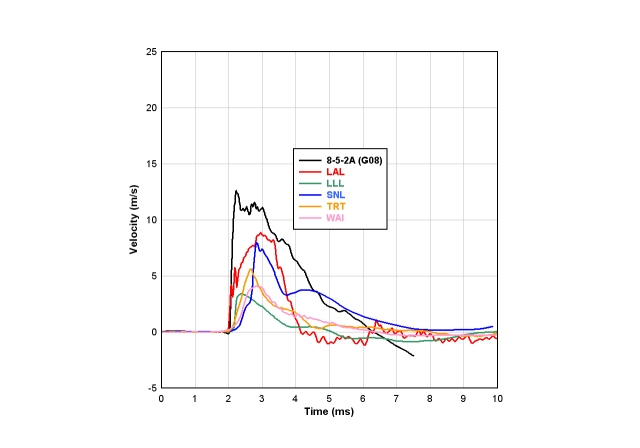
Chart #1 shows a screen capture from DPlot of the example file (95%-Data-loglog.grf)
Chart #2 shows a DPlot copy with bitmap Height=Width=0 and Paste Special as EMF into PowerPoint. Note the legend has not been properly scaled and neither have the "+" data markers.
Chart #3 is the same as Chart #2 with the images scaled by 50%; I consider the quality of this image to be acceptable.
Chart #4 shows a DPlot copy with bitmap Height=Width=0 and Paste Special as Device Independent Bitmap into PowerPoint. This image looks good, but ...
Chart #5 is the same as Chart #4 with the images scaled by 50%; I consider the quality of this image to be marginal.
Chart #6 shows a DPlot Save As *.png with Image Dimensions Height=Width=0 and Insert Picture into PowerPoint. This image looks good, but ...
Chart #7 is the same as Chart #6 with the images scaled by 50%; I consider the quality of this image to be marginal.
One might think the solution is to set the DPlot Plot Size to the desired final size, and then import into PowerPoint, e.g. 3x4.75.
Chart #8 is a screen capture of the sample file with Specify Plot Size Height=3 Width=4.75 in. Note the legend & "+" do not properly scale.
Bottomline, I like the quality from the EMF, but something is wrong with the legend & plot symbols when it is imported into PowerPoint. This same 'wrongness' appears when a simple plot window resize is performed.
When similar EMF charts are copied from Excel and Paste Special is used in PowerPoint, they scale well and there is no distortion of the legend and plot symbols. DPlot EMF's scale well, but distort the legend & plot symbols.
I used the latest release of DPlot 2.0.1.2
Thanks for listening, --len
Posted: Sun Oct 02, 2005 2:57 pm
by DPlotAdmin
Len,
First, please don't ever worry about trying my patience.
But...
One might think the solution is to set the DPlot Plot Size to the desired final size, and then import into PowerPoint, e.g. 3x4.75.
Chart #8 is a screen capture of the sample file with Specify Plot Size Height=3 Width=4.75 in. Note the legend & "+" do not properly scale.
But... there's no scaling involved here.
If you use "Specify plot size" then a copied enhanced metafile should always be very close in appearance to what you see in a DPlot document window. And that's the case here. As for the legend and symbol size within DPlot... the size of the legend is determined by the size of the fonts used. If you use "Specify plot size"
and those dimensions will fit within the DPlot document window, then those actual font sizes will be used. Same for symbol sizes. If those dimensions will
not fit in the DPlot document window, then the plot and everything about the plot (including font and symbol sizes) will be scaled down.
If I've misunderstood your point or if you still see a problem, please let me know.
Posted: Sun Oct 02, 2005 5:54 pm
by Schwer
OK, I think I have this figured out, at least for Enhanced MetaFiles (EMF) into PowerPoint.
#1 - In DPlot create a plot window that looks acceptable WITH the Plot Size (WYSIWYG) enabled, e.g. Width 6.4 and Height 4.0, and all fonts adjusted to an 'appropriate' size.
#2 - Use the Edit>Copy>Picture command to copy to the clipboard; since the Plot Size box is check, and dimensions set, there is no need to adjust Edit>Copy>Dimensions for EMF files, but for bitmaps one needs to set width & height to zero.
#3 - In PowerPoint "Paste Special" the clipboard as "Picture (Enhanced MetaFile)"
#4 - Scale the picture as required. If results are not saisfactory, return to step one and adjust the font sizes.
I hope this helps someone. If someone has a better technique please let me know.
Thanks again David for your help and patience, --len