Hi.
Subject says it all really. What I'm looking for is the ability to simply and easily plot:
1. A family of Mohr's Circles and
2. p-q (s-t) plots with a best fit line showing cohesion and friction angle.
from a table of major minor stresses Sigma1 and Sigma3. i.e. highlight the data and press go and it produces both plots.
I currently do this with a spreadsheet, it's not rocket science, but it would be really nice in DPLOT.
http://www.usace.army.mil/usace-docs/en ... 02/a-d.pdf
Cheers
Kristian
Mohr's Circles and p-q (s-t) plots from Sigma1 and Sigma3
Moderator: DPlotAdmin
-
DPlotAdmin

- Posts: 2312
- Joined: Tue Jun 24, 2003 9:34 pm
- Location: Vicksburg, Mississippi
- Contact:
That's an excellent suggestion, thanks. And thanks for the reference.
Visualize Your Data
support@dplot.com
support@dplot.com
-
DPlotAdmin
- Posts: 2312
- Joined: Tue Jun 24, 2003 9:34 pm
- Location: Vicksburg, Mississippi
- Contact:
Kristian,
At your convenience please send me an example set or 2 of your stresses Sigma1 and 3 to work with.
At your convenience please send me an example set or 2 of your stresses Sigma1 and 3 to work with.
Visualize Your Data
support@dplot.com
support@dplot.com
-
DPlotAdmin
- Posts: 2312
- Joined: Tue Jun 24, 2003 9:34 pm
- Location: Vicksburg, Mississippi
- Contact:
Kristian,
Thanks for the examples. I'm reasonably certain I've done this correctly but it may not be quite the implementation you had in mind. Your comments are welcome. You can get the Mohr's Circle plugin from http://www.dplot.com/plugins/generate/mohr.dll (56Kb). Copy that file to the \plugins\generate folder below dplot.exe. It expects a single "curve" with X values=sigma1, Y values=sigma3 and produces a new document.
I ran across a couple of bugs in DPlot related to plugins that generate a new document and default array sizes being too small. When that happens the plugin will fail w/o an error message. This is fixed on my system; on yours before you run Generate>Mohr's Circle you'll need to set the maximum number of curves to the number of data points in your input plus one (or anything larger) and the maximum number of points/curve to 181 or more. Those values are copied to the new document when the plugin runs.
From your PQ_plots1.zip, I get sigma1 and sigma3 values of:
329 46
630 185
387 89
524 140
127 32
359 108
584 118
540 141
170 42
608 112
145 34
213 64
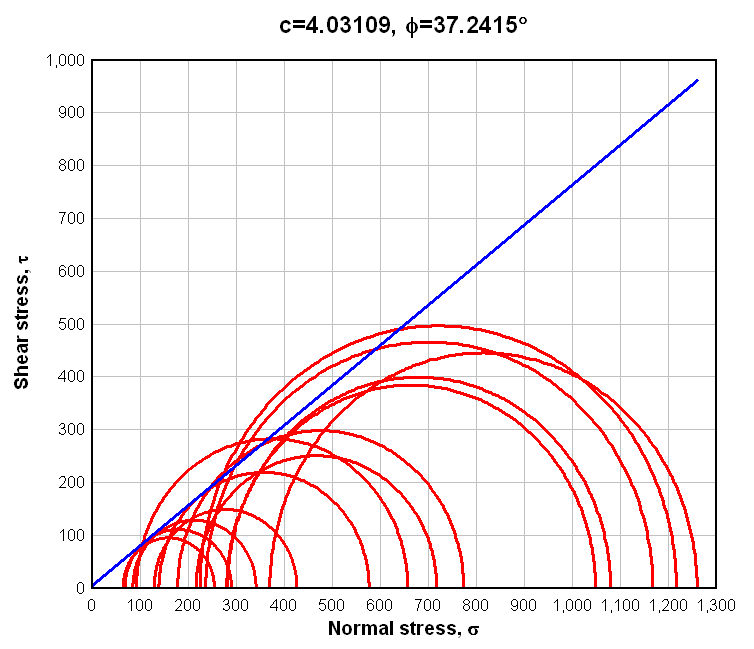
If you copy those values to a blank document, then select Generate>Mohr's Circle, you should get a new graph that looks something like:
Unless it is just blind luck, your circles won't be circular. I've changed DPlot to accept command strings from plugins and this (making circular circles) will be handled automatically as in the image above.
Again, comments and suggestions are welcome.
Thanks for the examples. I'm reasonably certain I've done this correctly but it may not be quite the implementation you had in mind. Your comments are welcome. You can get the Mohr's Circle plugin from http://www.dplot.com/plugins/generate/mohr.dll (56Kb). Copy that file to the \plugins\generate folder below dplot.exe. It expects a single "curve" with X values=sigma1, Y values=sigma3 and produces a new document.
I ran across a couple of bugs in DPlot related to plugins that generate a new document and default array sizes being too small. When that happens the plugin will fail w/o an error message. This is fixed on my system; on yours before you run Generate>Mohr's Circle you'll need to set the maximum number of curves to the number of data points in your input plus one (or anything larger) and the maximum number of points/curve to 181 or more. Those values are copied to the new document when the plugin runs.
From your PQ_plots1.zip, I get sigma1 and sigma3 values of:
329 46
630 185
387 89
524 140
127 32
359 108
584 118
540 141
170 42
608 112
145 34
213 64
If you copy those values to a blank document, then select Generate>Mohr's Circle, you should get a new graph that looks something like:
Unless it is just blind luck, your circles won't be circular. I've changed DPlot to accept command strings from plugins and this (making circular circles) will be handled automatically as in the image above.
Again, comments and suggestions are welcome.
Last edited by DPlotAdmin on Mon Nov 24, 2008 11:57 am, edited 1 time in total.
Visualize Your Data
support@dplot.com
support@dplot.com
Wahaaayy!! Wow you're quick... Thank you! 
Well I just copied and pasted your list above when I looked in my PQ_plots 1, my s1, s3 were ??? i.e. where did you get THOSE numbers ???
657.0 92.0
1259.7 369.5
773.5 177.7
1048.3 279.9
254.0 64.0
717.2 216.2
1167.4 236.0
1079.5 281.5
340.9 84.1
1216.8 224.0
289.6 68.0
425.8 128.6
576.3 138.5
here's what I get using your list, just copied from above and directly pasted in Dplot. Slightly different?

No the circles are not round.... hey even my spreadsheet has a macro to make them round LOL! (All in good time!).
So how about the s-t (p-q) curves and the second option m-c alternate, can you plot those too? (Please). What happens if regressed c< 0?
k.
Well I just copied and pasted your list above when I looked in my PQ_plots 1, my s1, s3 were ??? i.e. where did you get THOSE numbers ???
657.0 92.0
1259.7 369.5
773.5 177.7
1048.3 279.9
254.0 64.0
717.2 216.2
1167.4 236.0
1079.5 281.5
340.9 84.1
1216.8 224.0
289.6 68.0
425.8 128.6
576.3 138.5
here's what I get using your list, just copied from above and directly pasted in Dplot. Slightly different?
No the circles are not round.... hey even my spreadsheet has a macro to make them round LOL!
So how about the s-t (p-q) curves and the second option m-c alternate, can you plot those too? (Please). What happens if regressed c< 0?
k.
-
DPlotAdmin
- Posts: 2312
- Joined: Tue Jun 24, 2003 9:34 pm
- Location: Vicksburg, Mississippi
- Contact:
Well I just copied and pasted your list above when I looked in my PQ_plots 1, my s1, s3 were ??? i.e. where did you get THOSE numbers ???
On your PQWorksheet page, column B is p'=(sigma1+sigma3)/2, C is p'=(sigma1-sigma3)/2. So sigma1 = B+C, sigma3=B-C. Except ARRGGGH, that's not what I did. I used (B+C)/2 and (B-C)/2. Whoops.
Yes, but only because of a formatting goof. The numbers I pasted here had 0 decimal places. The numbers I used in DPlot didn't have that limitation.here's what I get using your list, just copied from above and directly pasted in Dplot. Slightly different?
If I do the darn thing correctly I get the same values you show in columns N and O, which produces this plot:
I'm sure that won't be a problem after I spend a bit of time looking it over. (It has been a few decades since I've needed to think about Mohr's circlesSo how about the s-t (p-q) curves and the second option m-c alternate, can you plot those too? (Please). What happens if regressed c< 0?
C < 0 isn't handled properly now; the plot will be clipped at Y=0. I'll fix that. (Actually in your version of DPlot it will come out OK, since DPlot will ignore the plugin's attempt to force the extents.) And after writing this it occurs to me that that's not what you meant... you mean that C should not be allowed to be less than 0, right? I hadn't thought of that, thanks.
Visualize Your Data
support@dplot.com
support@dplot.com
Thassbetter!If I do the darn thing correctly I get the same values you show in columns N and O, which produces this plot:
No worries, this isn't rocket science... it's just regression. I tried researchign forced regression where you fix c and let it regress phi, but while stats s/w like R can do this, Excel is much tricker, and the Rsquared values go down the tubes anwyay. Would still be a nice option though!I'm sure that won't be a problem after I spend a bit of time looking it over. (It has been a few decades since I've needed to think about Mohr's circles
Yep...that's what my second line does.. that awful...you mean that C should not be allowed to be less than 0, right? I hadn't thought of that, thanks.
phi=INDEX(LINEST(RoscoeAllData_t,RoscoeAllData_s,IF(INTERCEPT(RoscoeAllData_t,RoscoeAllData_s)<0,FALSE,TRUE)),2) setup and
c= =INDEX(LINEST(RoscoeAllData_t,RoscoeAllData_s,IF(INTERCEPT(RoscoeAllData_t,RoscoeAllData_s)<0,FALSE,TRUE)),1)
k.
Mohrs plots with sigma1 and sigma 3
Hi,
I was looking for the mohrs plotting program with sigma1 and sigma 3 data and was impressed with dplot capabilities to do this. However, i was disappointed when i downloaded a trial version and could not find the generate>mohrs feature as suggested in one of the discussion forum replies. I am ready to buy this but want to make sure Mohrs feature is available.
Any clues or suggestion appreciated.
Thanks
Laxmi
-
DPlotAdmin
- Posts: 2312
- Joined: Tue Jun 24, 2003 9:34 pm
- Location: Vicksburg, Mississippi
- Contact:
You can get the Mohr's Circle plugin here: http://www.dplot.com/plugins/generate/mohr.dll
Create a \plugins\generate folder below dplot.exe, save the file to that folder. The next time you run DPlot you should see a "Mohr's Circle" menu item on the Generate menu.
(I got your phone message but a nasty bug has me unable to speak much at the moment. I'll be happy to answer any of your questions here or by e-mail.)
Last edited by DPlotAdmin on Tue Oct 07, 2008 11:41 pm, edited 1 time in total.
Visualize Your Data
support@dplot.com
support@dplot.com
Mohrs plots
Thank you David for prompt response.
I have tried using a pair of Sigma1 and sigma3 numbers and it plots Ok. But not sure the plots were going through the origin which is some thing odd and want to make sure the program you wrote is correct. I will try more pairs and see how it is coming up. Is there any way to import data from excel? I am sure there should be a way as I have not gone through whole of the features. Once these are clarified I will go for it.
Thanks
Laxmi
-
DPlotAdmin
- Posts: 2312
- Joined: Tue Jun 24, 2003 9:34 pm
- Location: Vicksburg, Mississippi
- Contact:
If you didn't get my previous e-mail response, here it is again:
As far as I can tell the code is correct. I'm not sure what you mean about going through the origin. If you have an example data set you can send me I will be happy to take a look at it.
There are a couple of ways to import data from Excel. Both depend on your data being arranged in columns. If you have sigma1 in one column, sigma3 in another column, you can either 1) select the data, Copy, then Paste in DPlot. Or 2) if you elected to install the DPlot Add-In, select the data then select the XYXY command on the DPlot menu.
Visualize Your Data
support@dplot.com
support@dplot.com
-
DPlotAdmin
- Posts: 2312
- Joined: Tue Jun 24, 2003 9:34 pm
- Location: Vicksburg, Mississippi
- Contact:
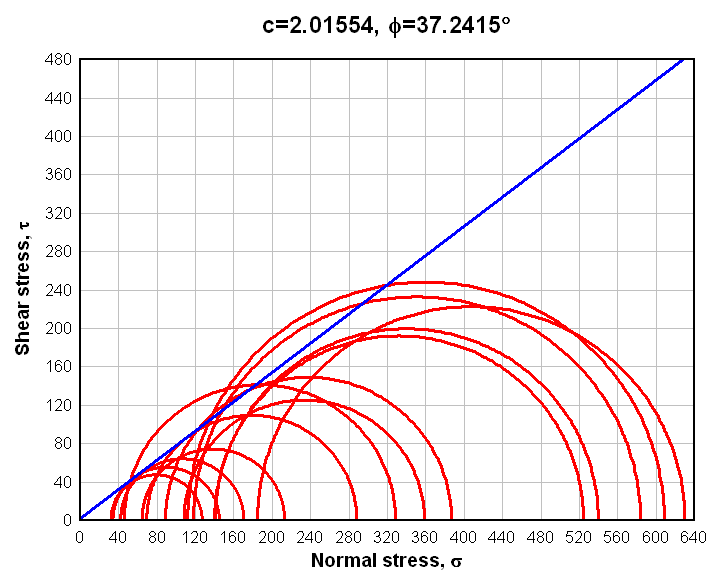
If you copy/paste those 3 pairs into a blank document in DPlot, then select Generate>Mohr's Circle, you should get a plot with 3 semi-circles:
center radius
56.5 46.5
50.7 40.5
25.9 20.5
and a blue line with intercept c=0, slope phi = 54.106 deg.
Is that not what you get?
center radius
56.5 46.5
50.7 40.5
25.9 20.5
and a blue line with intercept c=0, slope phi = 54.106 deg.
Is that not what you get?
Visualize Your Data
support@dplot.com
support@dplot.com
Yes that is what i get. However, c is zero which is bit confusing. Most of the time we will not get zero. May be this is the case. I have to re-check with other data.
However, i liked the feautres of the program and would buy for sure after going through the details of the features tomorrow.
Your prompt response is very much appreciated.
Laxmi
However, i liked the feautres of the program and would buy for sure after going through the details of the features tomorrow.
Your prompt response is very much appreciated.
Laxmi
Mohr's circles skewed
Hi david,
I have the following values for mohr's plots in MPa.
sigma1 sigma3
23.6 14.2
18.1 10.2
20.5 12
I get a good plot, however, the circles are skewed when i tried to re-size the plot to 4x3 inch. Any solution for this? I tried re-scaling etc but the circles gets screwed up.
Thnaks
Laxmi
I have the following values for mohr's plots in MPa.
sigma1 sigma3
23.6 14.2
18.1 10.2
20.5 12
I get a good plot, however, the circles are skewed when i tried to re-size the plot to 4x3 inch. Any solution for this? I tried re-scaling etc but the circles gets screwed up.
Thnaks
Laxmi
-
DPlotAdmin
- Posts: 2312
- Joined: Tue Jun 24, 2003 9:34 pm
- Location: Vicksburg, Mississippi
- Contact:
You need to set the extents along with the plot size if you want the circles to be circular. When I run the plugin with those values I get extents of 0-24 in X and 0-6 in Y, with the plot size = 12" x 3". Notice that the X extents are 4x the Y extents, and the X size is 4x the Y size.
For a 4"x3" plot you need the X extents to be 4/3 x the Y extents, e.g. 8<X<24 and 0<Y<12. (You might also need to set the tick mark intervals to 1.0 or some other number that divides evenly into the extents.)
For a 4"x3" plot you need the X extents to be 4/3 x the Y extents, e.g. 8<X<24 and 0<Y<12. (You might also need to set the tick mark intervals to 1.0 or some other number that divides evenly into the extents.)
Visualize Your Data
support@dplot.com
support@dplot.com
-
DPlotAdmin
- Posts: 2312
- Joined: Tue Jun 24, 2003 9:34 pm
- Location: Vicksburg, Mississippi
- Contact:
Another suggestion for improving dplot is;
when we play with failure plot with bunch of mohr's circles, the failure slope does not change with removal of some circles which does not fit well. we have re-plot the circles with eliminated data to get a new failure line. Is there any way to make the failure line or trendlines to change instantly with change in data?
Like in excel, the trendlines should change with change in data (data points delition or addition). I have not explored dplot whether this feature is existing or not.
Thanks for your attention.
Laxmi
-
DPlotAdmin
- Posts: 2312
- Joined: Tue Jun 24, 2003 9:34 pm
- Location: Vicksburg, Mississippi
- Contact:
This probably won't happen. The problem is there are too many ways for you to edit a graph in which your intentions would be ambiguous to the code. For example instead of deleting a circle, what should happen if you add one? What if you add one that's nonsense (for example with Y > 0)? Or what if you add a new curve whose shape is only roughly semicircular? What should happen if you clip an existing semicircle with Edit>Truncate?
Data processing mode in DPlot works in the way you'd like this to work: changes in one curve automatically update one or two other curves. So it can be done, but the reason data processing mode works is you're prohibited from making the sort of changes mentioned above. You can't add or delete a curve or perform many of the standard operations.
I'll think on this one more, but my initial guess is you'll be stuck with selecting Generate>Mohr's Circle when you want a new plot.
Visualize Your Data
support@dplot.com
support@dplot.com