I'm working on a linear programming problem here, finally stumbling upon a program that can actually graph linear inequalities for me! However, I am running into trouble in having them display correctly.
If anyone knows anything about linear programming problems, they are just a bunch of constraint inequalities with the shaded region as the answer.
My constraints are:
y<-x+40000
y>-x+18000
y<-x+20000
Whenever I try to do it, my graph looks quite strange. Could someone give this a shot and see if it looks "correct"? Thanks for your time.
I think what might be making it difficult is the large numbers.
How Do I Graph These Inequalities?
Moderator: DPlotAdmin
Hoping that I'm not making myself out to be a fool, since I'm REAL rusty with this stuff, but doesn't the first equation kind of get eliminated by the last one? The way I plotted it out, the solution is just a downward sloping band constrained by the second and third equations. The first equation isn't part of the solution. (Don't forget to check "Draw only the intersections" box.)
But in tinkering with the mechanics of putting an equation into the y=f(x) dialog box (yes, I tried y="<0-x+40000" from -40000 to +40000), I found that DPlot (2.1.3.8) doesn't like to see the < or > symbol as the first character in the dialog. DPlot crashed to the desktop immediately.
But in tinkering with the mechanics of putting an equation into the y=f(x) dialog box (yes, I tried y="<0-x+40000" from -40000 to +40000), I found that DPlot (2.1.3.8) doesn't like to see the < or > symbol as the first character in the dialog. DPlot crashed to the desktop immediately.
-
DPlotAdmin

- Posts: 2312
- Joined: Tue Jun 24, 2003 9:34 pm
- Location: Vicksburg, Mississippi
- Contact:
Yes, it does. y<-x+40000 is made irrelevant by y<-x+20000.Hoping that I'm not making myself out to be a fool, since I'm REAL rusty with this stuff, but doesn't the first equation kind of get eliminated by the last one?
I'll have to look into this. If I understand what you did correctly, DPlot should have replied with a syntax error rather than crashing.But in tinkering with the mechanics of putting an equation into the y=f(x) dialog box (yes, I tried y="<0-x+40000" from -40000 to +40000), I found that DPlot (2.1.3.doesn't like to see the < or > symbol as the first character in the dialog. DPlot crashed to the desktop immediately.
To get this plot:
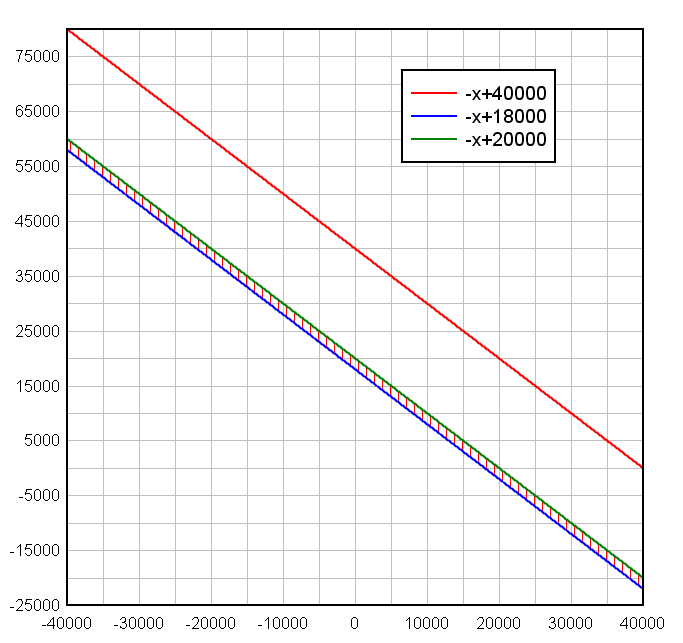
1. Use Y=f(X) with Y=-X+40000
2. Y=f(X) with Y=-X+18000
3. Y=f(X) with Y=-X+20000
4. Fill Between Curves with "1st Curve"=-X+40000, 2nd Curve=Bottom.
5. Fill Between Curves with "1st Curve"=-X+18000, 2nd Curve=Top.
6. Fill Between Curves with "1st Curve"=-X+20000, 2nd Curve=Bottom.
7. Fill Between Curves, check "Draw only the intersections..."
Visualize Your Data
support@dplot.com
support@dplot.com
Haha yeah, it looks like I gave you guys the wrong constraints.
Y=-X+40000
Y=-X+18000
Y=-3*X+60000
should be the right ones, however, I'm putting in:
-X+40
-X+18
-3*X+60
just because the numbers are smaller, so I can just learn how this thing works.
Here's the problem I'm getting. When I put in -X+40 for example, I get a plot at 40 on the y-intersect, however it does go down one, and over one, but only once! See the picture below for clarification. The line just stops. Anybody have any ideas? Thanks.
http://i23.tinypic.com/2wgf53k.jpg
-
DPlotAdmin
- Posts: 2312
- Joined: Tue Jun 24, 2003 9:34 pm
- Location: Vicksburg, Mississippi
- Contact:
Check the extents you're using with Y=f(X) (the From X and To X values)Here's the problem I'm getting. When I put in -X+40 for example, I get a plot at 40 on the y-intersect, however it does go down one, and over one, but only once!
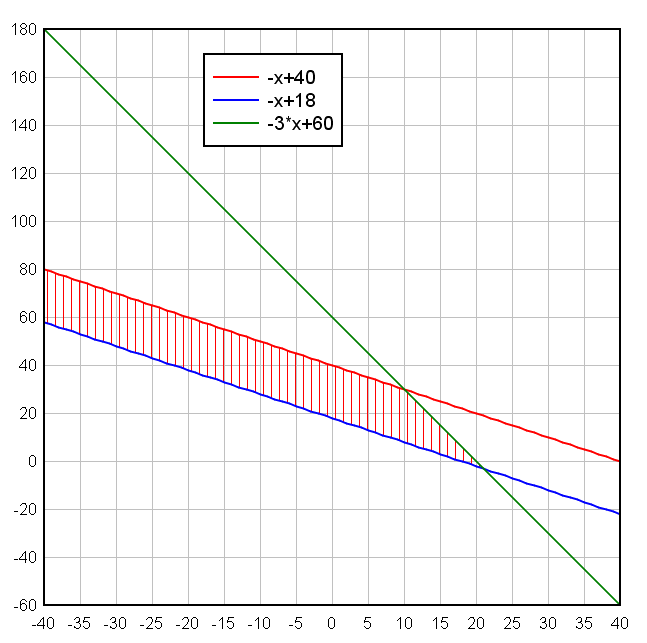
For:
Y<-X+40
Y>-X+18
Y<-3*X+60
I used Y=f(X) for:
Y=-X+40
Y=-X+18
Y=-3*X+60
with From X=-40, To X=40 for all 3 curves, then used Fill Between Curves as before, and get this:
Visualize Your Data
support@dplot.com
support@dplot.com
Thank you! I didn't really notice the extents for Y=f(X), only those for the whole graph and that's what messed it up. Changed the extents around and it works. The graph displays exactly how I want it. I also like the function that labels where the lines intersect as well. Thanks for creating such a nice program. Now I have a nice graph for my math project. 