Good evening. This thread is related to an earlier one on multiple plots and layering. I've gotten past the merged graph issue, now would like to overlay the merged, data plot on a photo image.
I can import the image as a BMP, however I'm unable to come up with a palette that even closely matches a photographic colour scheme. Grayscale works just fine. Any ideas?
While I'm at it, is there a way to place one XYZ surface plot over another as a layer?
Thanks for any help you can provide.
All the best
-John
Palette suggestions for importing photos as bmp
Moderator: DPlotAdmin
-
John Horrigan
- Posts: 16
- Joined: Mon Apr 07, 2008 9:46 am
- DPlotAdmin
- Posts: 2312
- Joined: Tue Jun 24, 2003 9:34 pm
- Location: Vicksburg, Mississippi
- Contact:
John,
You'll have better luck with 24-bit images rather than 8-bit, but beyond that I'm not sure what you're asking.
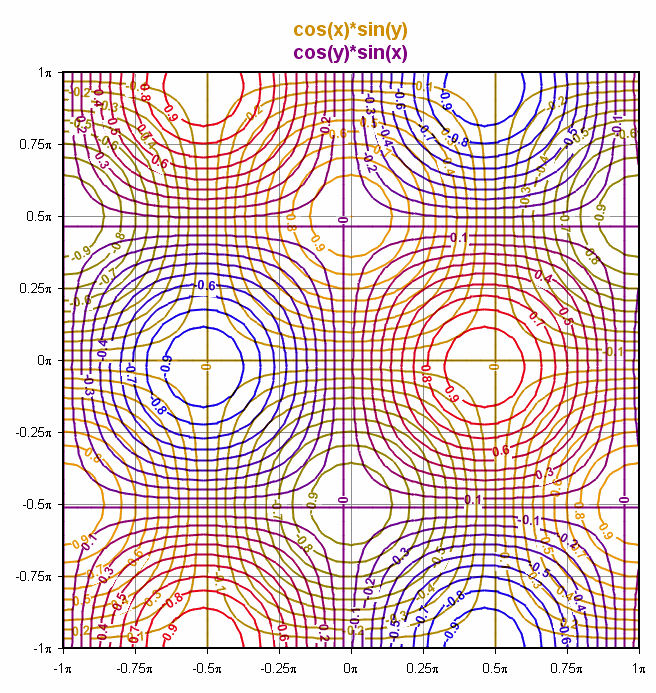
There's no way within DPlot to have multiple surfaces in the same plot. That's on my to-do list but it will likely be a while before this is done. If you're mainly interested in 2D plots with contour lines (not 3D views or shaded bands) then you can do this outside DPlot with any good image editor. The example below was done in Paintshop Pro by pasting the second image into the first as a layer, then setting the "Blend mode" of the layer to "Multiply". No other editing was done. Other than making the plots the same size in DPlot, the only thing a bit different that I did here was add a \n after one title line and before the other. Is something like this what you had in mind?

Visualize Your Data
support@dplot.com
support@dplot.com