Hi,
So Far, I'm enjoying the ease-of-use with DPlot, but hitting a significant Snag with the current project I'm working on:
I'm trying to Generate 3-D Surfaces for data similar to that below:
X Y Z
11950 8219 12.8
17170 6588 14.2
29770 20281 13.1
31330 28000 14.1
7730 16417 12.3
23384 33447 11.8
33692 33619 11.4
11565 26306 12.6
However, whenever I try to use the Mesh Command in order to smooth out the data, 90% of the time it crashes (Just suddenly closes down);
I'm loading the data directly into Dplot and the contour map loads without a problem; I've tried a variety different options - Defining Extents, Allowing/Disabling Extrapolate points outside convex Hull, changing Intervals and the number of control points.
Sometimes the options I tried previously, unsuccessfully, suddenly work; Or alternatively, when I try change a few Z-values to the original and remesh using the previously succesful settings, it crashes again.
Any Ideas?
I'm running Windows XP if it makes any difference?
Thanks for the Help!
Problems with Meshing 3D graphs
Moderator: DPlotAdmin
-
DPlotAdmin

- Posts: 2312
- Joined: Tue Jun 24, 2003 9:34 pm
- Location: Vicksburg, Mississippi
- Contact:
The "good" news, depending on how you look at it, is that your example causes problems for me on Windows 7, as well.
With linear interpolation it works.
Bivariate interpolation seems to crash most of the time - I could swear it worked the first time I tried with "Extrapolate points outside convex hull" unchecked, but now it doesn't. So that's a little weird. (My best guess is that I mistakenly operated on a surface with which I had already done a linear interpolation - which does work, but I realize that isn't what you're looking for.)
I suspect there is an overflow problem since your data is fairly sparse and so prone to large fluctuations in the interpolated results. But that's just a guess at this point.
Visualize Your Data
support@dplot.com
support@dplot.com
Thank you for the quick reply!
I have been trying a few times and it does seem a bit random on the success rate - Which is why I thought Windows XP might be misplacing/mismanaging the memory...
By Linear Interpolation, Do you mean the Planar Interpolation? Alternatively, if it is a problem resulting from sparse data, Do you think by taking the Intervals in X and Y down drastically (from 32 down to 4) and repeatedly meshing it (4 times) it would be a near equivalent to one mesh of 32?
Any other ideas of a work around?
Again, Thanks for the Help!
-
DPlotAdmin
- Posts: 2312
- Joined: Tue Jun 24, 2003 9:34 pm
- Location: Vicksburg, Mississippi
- Contact:
Yes, my mistake.By Linear Interpolation, Do you mean the Planar Interpolation?
That gets around the crash, but you lose too many details doing that. And once they're lost you can't get them back.Alternatively, if it is a problem resulting from sparse data, Do you think by taking the Intervals in X and Y down drastically (from 32 down to 4) and repeatedly meshing it (4 times) it would be a near equivalent to one mesh of 32?
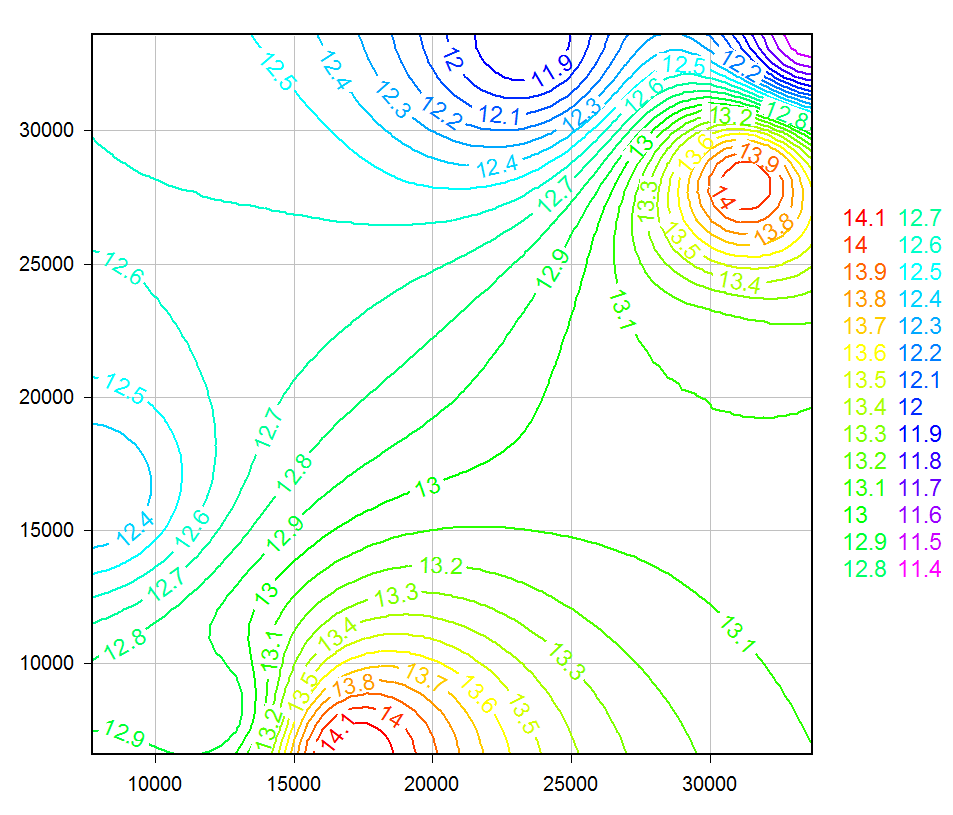
I haven't found the problem with the bivariate interpolation yet, but did go ahead and add another method that I've meant to for a while: Quadratic interpolation uses the inverse of the square of the distance to each of the input points as a weighting function to generate the output. It preserves peaks and valleys and is of course much smoother than the surface you get with planar interpolation, but it doesn't use slopes or second derivatives like the bivariate method does. This is both good and bad, depending on your input. You'll get a smooth surface but a smooth surface isn't always the "right" answer. Here's your input after using that method:
Visualize Your Data
support@dplot.com
support@dplot.com
The Quadratic Interpolation shown below looks very good at a glance - I'm not expecting much in the way of sudden changes in the data, so the smooth curves look appropriate.
When do you think the addition of the Quadratic Interpolation Function will make it to the updates section?
Again - Thank you for the prompt and quick help!
When do you think the addition of the Quadratic Interpolation Function will make it to the updates section?
Again - Thank you for the prompt and quick help!
-
DPlotAdmin
- Posts: 2312
- Joined: Tue Jun 24, 2003 9:34 pm
- Location: Vicksburg, Mississippi
- Contact:
I always try to make updates on the weekend, but this weekend is out for that. If not sometime in the next few days then no later than next weekend.When do you think the addition of the Quadratic Interpolation Function will make it to the updates section?
Visualize Your Data
support@dplot.com
support@dplot.com
-
DPlotAdmin
- Posts: 2312
- Joined: Tue Jun 24, 2003 9:34 pm
- Location: Vicksburg, Mississippi
- Contact:
Done. If you have a license you can get the update using Help>Check for Updates. Or if you're a licensed user signed up for the mailing list, the mail is on its way.
In 2.2.9.1 "Extrapolate..." is disabled for the bivariate interpolation method. (I think I probably overstepped my bounds with this routine and it never should have been enabled to start with.) And there's the new "Quadratic" method I mentioned, which does allow "Extrapolate..." and gives, in all cases I've experimented with, a nice smooth surface that it would be hard to argue against. The main difference between the two is that the bivariate method takes into account the local slope and rate of change in the slope, while the quadratic method is smeared out more. Both methods will preserve peaks and valleys. The bivariate method may produce more realistic undulations where those are called for, but as your example pointed out - it doesn't do very well when extrapolating points outside the triangular mesh (which is now made irrelevant).
Please let me know if you have any problems with these changes.
Visualize Your Data
support@dplot.com
support@dplot.com
Magic! The plots are looking excellent - and it's running (so far) without a hitch. Thank you!
On a side note - I think you might be able to use the quadratic function for 4-d surfaces where the Z and the Value are independant of each other (But both dependent on the X,Y location; (Or alternatively a work around is to generate 2 meshes of the data (X,Y,Z and X,Y,Value and then edit:Copy:Data values and merge the 2 sets of data into X,Y,Z,value and plot the corresponding 4-D Meshed data...
But again, Thanks for your help!