Plot overlays

Beta releases, announcements and anything else that doesn't fit below. Please read the <B>Welcome</B> topic.

Moderator: DPlotAdmin

Post Reply
User avatar
DPlotAdmin
Posts: 2312
Joined: Tue Jun 24, 2003 9:34 pm
Location: Vicksburg, Mississippi
Contact:

Plot overlays

Post by DPlotAdmin »

Currently I'm working on overlaying one plot with another, as this topic seems to have come up frequently in the forums lately and especially in e-mails. This feature will most likely be available in the next release as an undocumented (except here) feature available only by macro command, until all the kinks are worked out (and there are many kinks associated with mixing data types, scales, etc.)

I've seen requests in the past for overlaying bar charts with line graphs, and contour plots with 2D plots. If you can point to an example, either on the 'net or in a pic you have (not necessarily limited to these cases), I'd be grateful. There's no doubt that if this subject has occurred to you, I probably haven't envisioned what you have. So let me know at support@dplot.com.

Teaser: Contour plot from SRTM N32091W file overlaid with Garmin Training Center TCX file from ride through Vicksburg Military Park:
Image
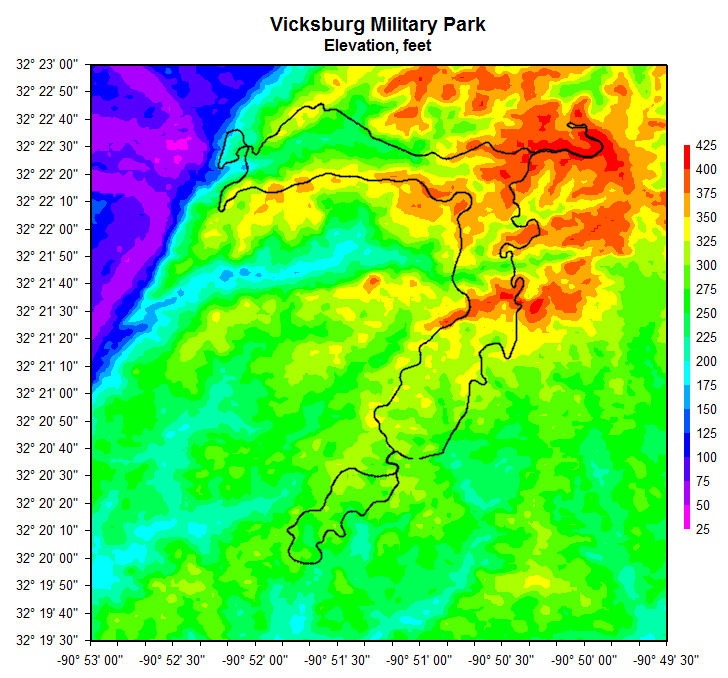
(Before you ask, the chances of displaying this in 3D are somewhat less than none. But thanks for the thought :-))
Visualize Your Data
support@dplot.com
DCdenizen
Posts: 21
Joined: Mon Sep 08, 2008 9:11 pm

Post by DCdenizen »

I just want to confirm that DPLOT cannot currently graph a scatter plot and a bar graph. Is this in fact the case?
User avatar
DPlotAdmin
Posts: 2312
Joined: Tue Jun 24, 2003 9:34 pm
Location: Vicksburg, Mississippi
Contact:

Post by DPlotAdmin »

You're correct; that does not work. I'll try to have this working correctly in the next release. Thanks for pointing out the problem.
Visualize Your Data
support@dplot.com
Post Reply