Plot overlays
Posted: Wed Jul 16, 2008 11:01 pm
Currently I'm working on overlaying one plot with another, as this topic seems to have come up frequently in the forums lately and especially in e-mails. This feature will most likely be available in the next release as an undocumented (except here) feature available only by macro command, until all the kinks are worked out (and there are many kinks associated with mixing data types, scales, etc.)
I've seen requests in the past for overlaying bar charts with line graphs, and contour plots with 2D plots. If you can point to an example, either on the 'net or in a pic you have (not necessarily limited to these cases), I'd be grateful. There's no doubt that if this subject has occurred to you, I probably haven't envisioned what you have. So let me know at support@dplot.com.
Teaser: Contour plot from SRTM N32091W file overlaid with Garmin Training Center TCX file from ride through Vicksburg Military Park:
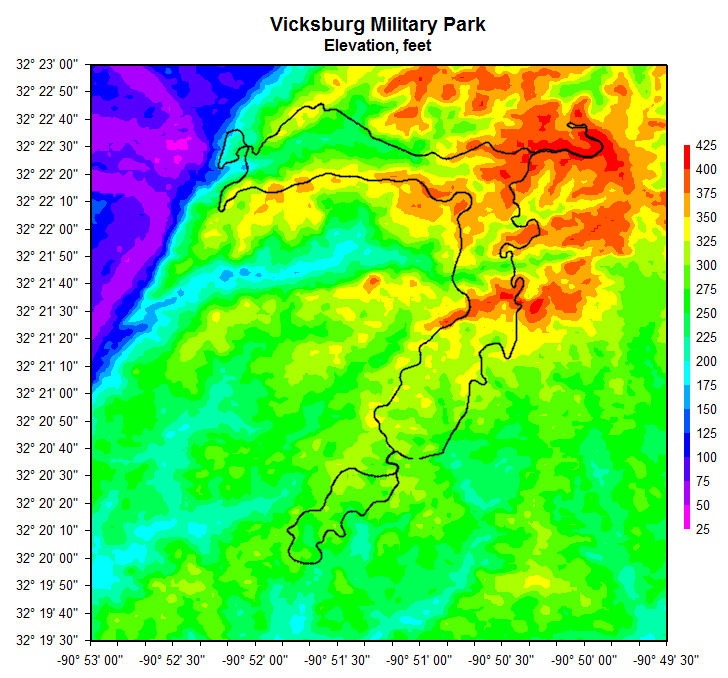
(Before you ask, the chances of displaying this in 3D are somewhat less than none. But thanks for the thought )
)
I've seen requests in the past for overlaying bar charts with line graphs, and contour plots with 2D plots. If you can point to an example, either on the 'net or in a pic you have (not necessarily limited to these cases), I'd be grateful. There's no doubt that if this subject has occurred to you, I probably haven't envisioned what you have. So let me know at support@dplot.com.
Teaser: Contour plot from SRTM N32091W file overlaid with Garmin Training Center TCX file from ride through Vicksburg Military Park:
(Before you ask, the chances of displaying this in 3D are somewhat less than none. But thanks for the thought